
Simple Laws For Chasing Win Probability
Simple Laws For Chasing Win Probability
The power of Pythagorean power laws

This is going to be a short, slightly numbers-heavy post.
@cric_analytics on Twitter has an array of simple and elegant “rules of thumb” for cricket, the most prominent of them being predictors of win probability from simple aggregate stats or current match states.
During the 3rd Australia - England ODI today, he tweeted out a general rule to tie the required runs and “expected” runs to the chances of winning a chase. His formula was:
Defending Team’s Winning Probability = 1 / ( 1 + R^8)
Where R = Expected Runs From That Situation / Required Runs
This is beautiful because it simply encodes the resources available to the batting side in the “expected runs” number, which is simply the mean runs an average team would score given the same overs and wickets left. The variable R compares this “ideal” average score to the runs actually needed, and it is logical that win probability is a function of that ratio. If the ratio is too high, meaning, the required runs are very few compared to the expected runs, the defending team has zero chance of winning.
Now, the exponent of 8 is arbitrary, by his own admission. So I set out to test this relation and find the best exponent value.
Dependence on Required Run Rate
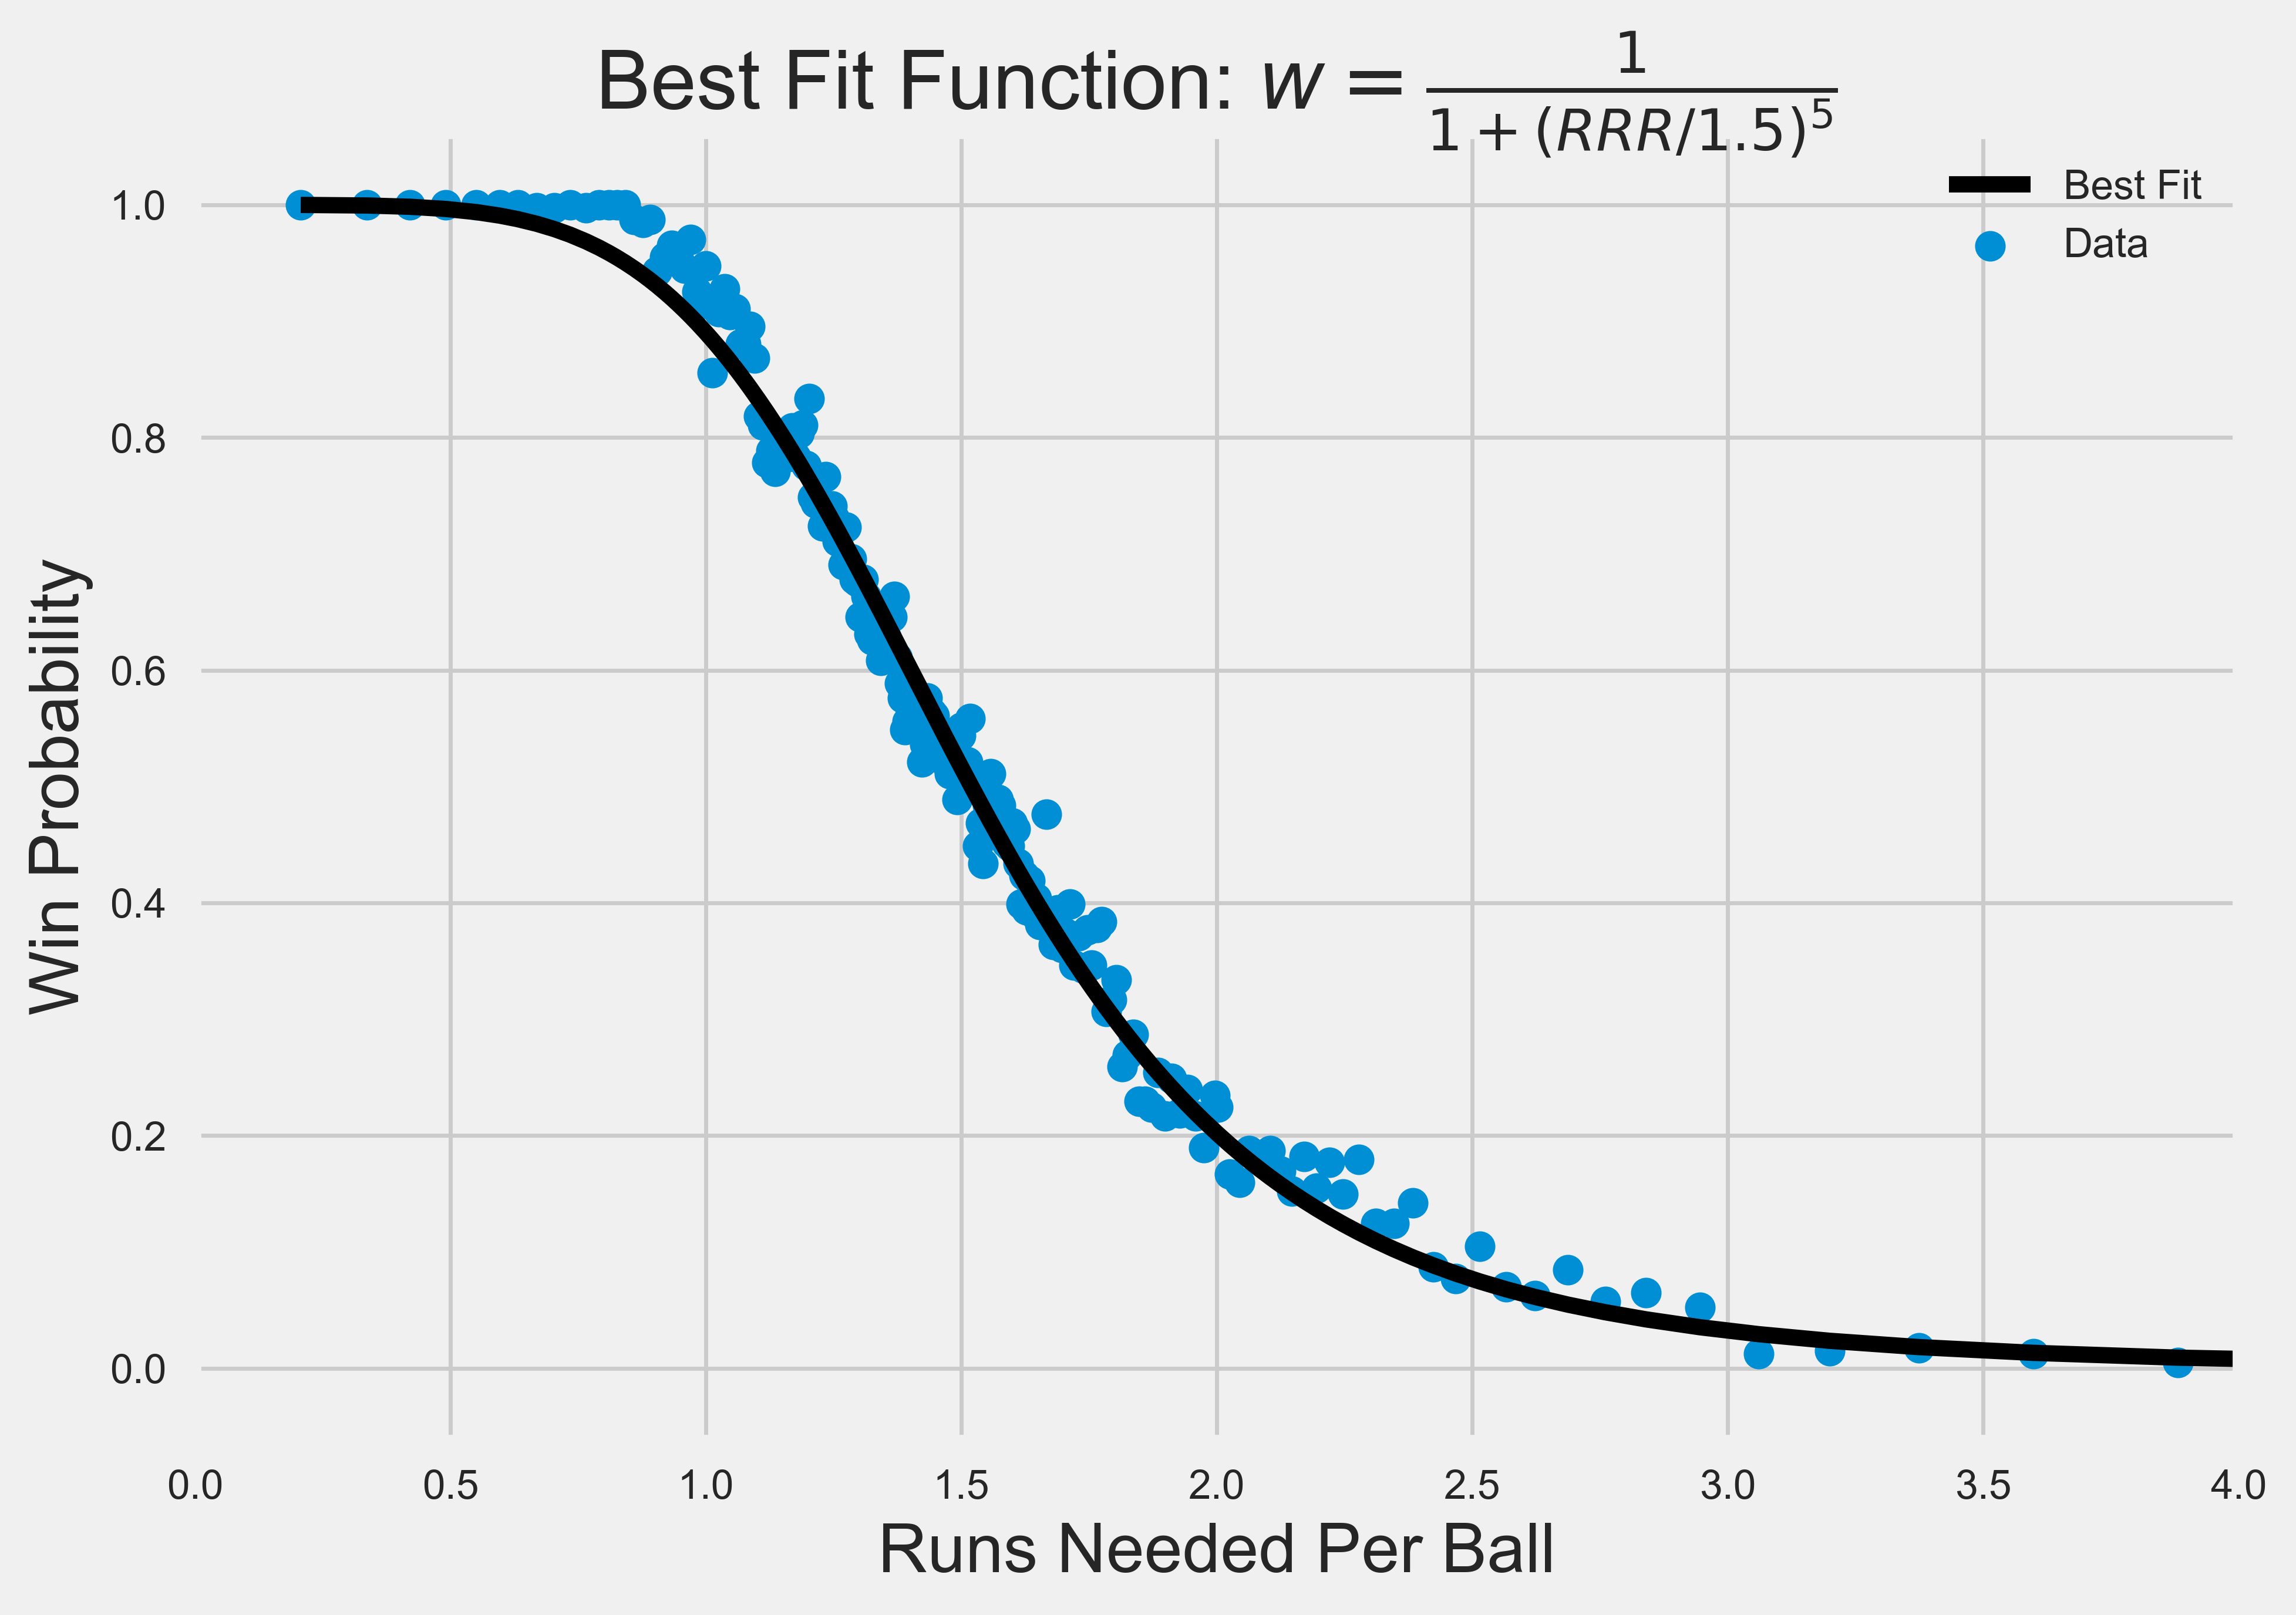
Even before I could do this, I found a neat dependence of the win probability of the chasing side on simply the required run rate.
Method
I took data from all IPL matches that had a result and were full 20-over designated games. The output variable was win or loss, encoded as 1 or 0. To fit the functional form to the win %, I binned the match results by required run rate. I then took the mean of the result in each bin as the y-value, and the mean of the required rate in each bin as the x-value. Each bin had 400 samples (I had 86000+ balls from the second innings of all games considered).
I then fit this to the functional form

Using scipy’s curve_fit function.
Results
The best fit results were a = 1.5 ± 0.003, n = 5 ± 0.06.
Here’s the plot. Now, the knee for low values of the RRR is a little more blunt than the data, but the slope is fit well. The RRR alone yields a surprisingly good prediction of winning chances, averaging across match situations in terms of wickets and balls left. Quite a pleasant discovery!
Expected To Required Runs
Now, what of our original plan?
We want to check if the ratio of “expected” runs to required runs has a relationship with the win probability of the defending team.
For this, first I must construct the “expected” runs. I do this by considering all completed first innings in the IPL, and then using a regression model to predict the average extra runs a team would score from a given situation.
Method
I feed in the features {wickets lost by team, balls left in team innings} as the input, and the extra runs scored from that point on as the output. I train a random forest regression model on this data, which yields an R^2 of 0.86.
I then use this to predict the runs expected to be scored by the average team at any given point in the innings.
I use this to get an “expected runs” value for each ball in my second innings dataset. So, for each ball in the 2nd innings data, I have the expected runs, and the required runs. I divide the two to get the ratio R.
Now, I do the same binning: I make bins with 400 data samples each, and take the mean of R and the win or loss (1 or 0) in each bin. These become my x and y values for fitting the same function:

Results
The best fit parameters for this are:
a = 0.98 ± 0.001, n = 5.56 ± 0.06
For simplicity, I’ll consider a = 1, n = 5.6.
Here’s the plot:

This is also quite a decent fit, quite good for a “rule of thumb”. The exponent is 5.4, but the general rule works perfectly.
(I tried another “expected runs” model that used only the balls and wickets left to predict the final score, and that yielded a best fit exponent of 5.6.)
On an ending note, let’s try to quickly look at Mumbai Indians’ win chances progressing through the second innings of the 2019 IPL final, just to see how this works.
Here’s the plot of expected and required runs for CSK:

And here’s the win probability for MI through the innings:
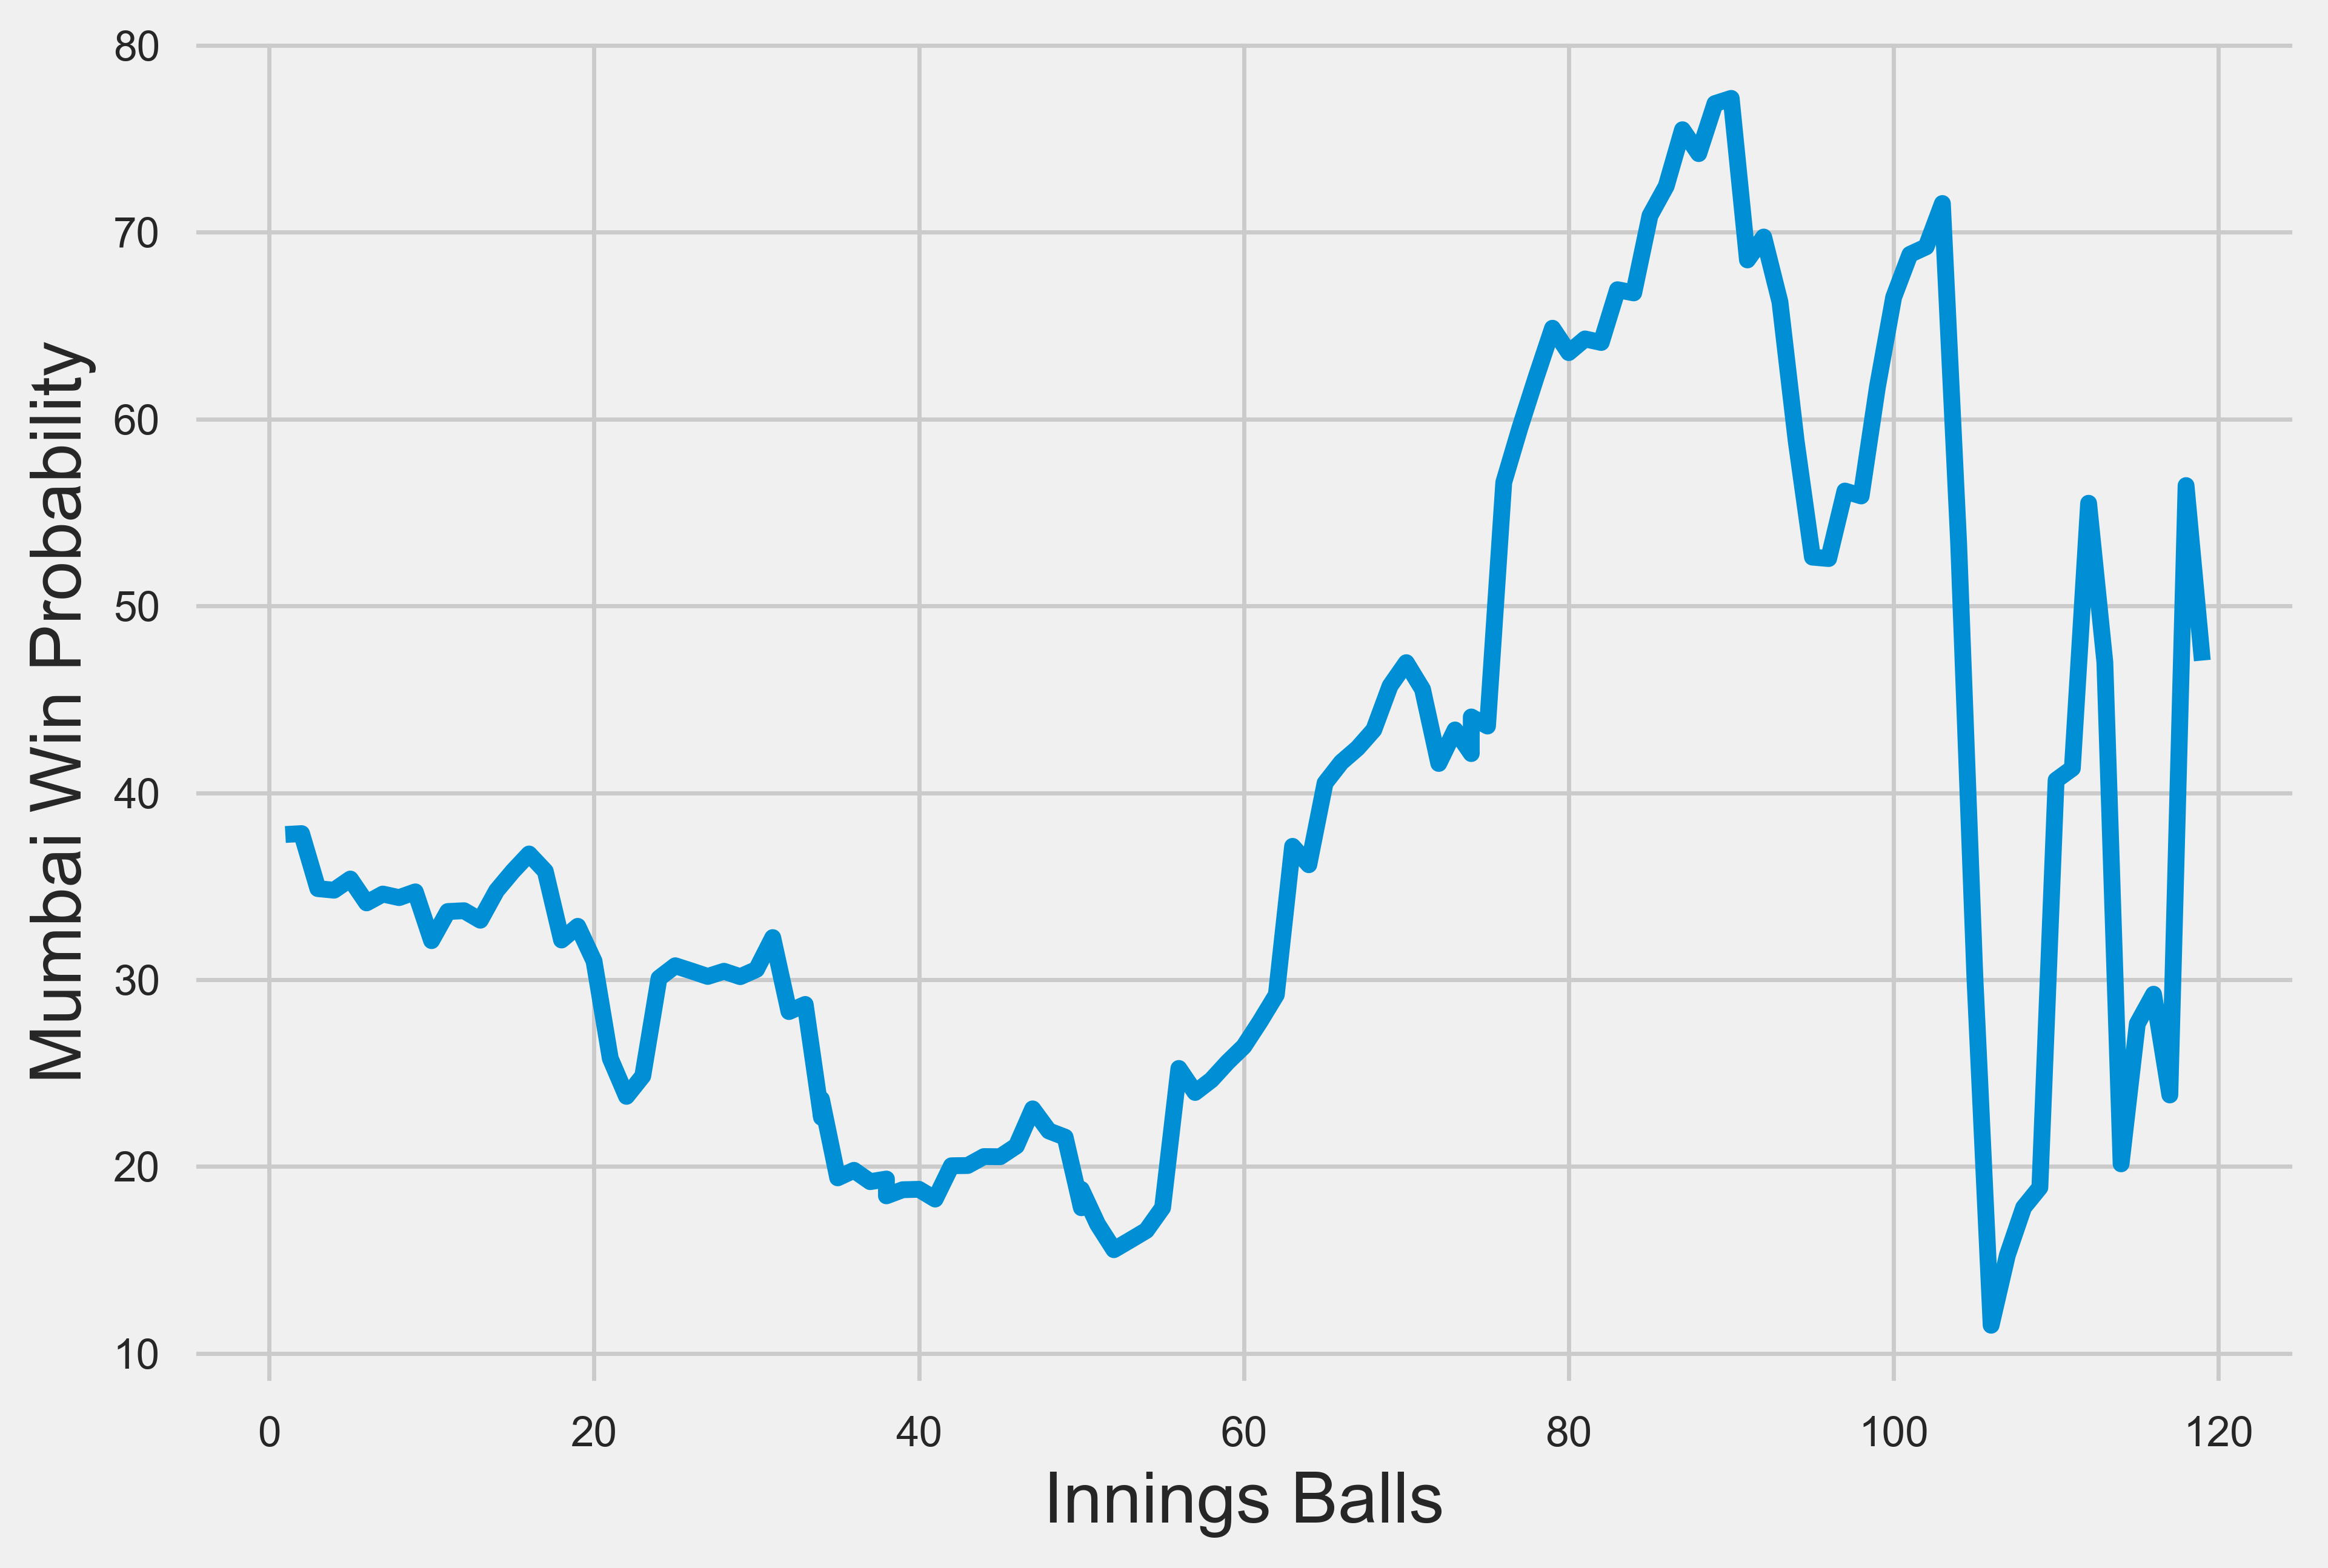
When the required runs are below the expected runs, the chasing side has a > 50% chance of winning. At about the 75-ball mark, the two cross, and the win probability swings in favour of the defending side.