
Recently @CricVestigate on Twitter posted about their all-rounder index, that seeks to rank Test match all-rounders on the basis of not only their averages, but their contributions to their teams. Batting average minus bowling average has been conventionally used to assess all-rounders, but as CricVestigate say on their 81allout podcast, it’s a flawed measure. A player averaging 35 with the bat and 25 with the ball is a great all-rounder, but someone with a 65 batting average and 55 bowling all-rounder will not be considered an all-rounder at all. The average differential is the same in both cases.
Another useless measure is aggregate runs and wickets. Jacques Kallis’s credentials as an all-rounder are embellished by citing his 200+ Test wickets to go with his 13000 runs. His big wicket tally is a result of a long career, and a glance shows he was a useful 5th bowler for a strong SA side, with a mean of 1.07 wickets per innings, and his classification as a great genuine all-rounder is dicey. By this logic, Shane Warne should be part of the same conversation, with 3100 runs and 700+ wickets.
The difference of batting and bowling averages is mathematically absurd: the scales for the two numbers are different, even though both are aggregate runs divided by aggregated dismissals. Adding or subtracting them is like adding 5 oranges to 7 clementines. To solve this, we will scale both down by their mean values, and use the differential of z-scores instead. I know I’ve been harping on about the z-score recently, but it’s an easy and elegant way to normalise many things. Batting and bowling averages are distributed nearly normally, so it makes sense to use z-scores.
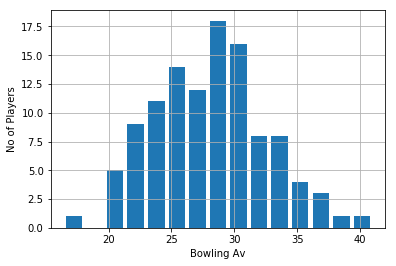
For batting, we pick all players with 2500 or more runs at an average better than 25. Here’s the distribution of averages:

The mean is 40.73 runs, with a standard deviation of 8.45 runs. We will be comparing our all-rounder’s batting stats with a batsman averaging 40. Fair enough.
For bowling, we pick all bowlers with more than 150 wickets. Their bowling averages are distributed like:
The mean is 28.08 with a standard deviation of 4.04 runs.
Here, we already see the difference in scales. If a 40 batting average is the “average” batsman and a 28 bowling average is the “average” bowler, then a bowler with 25ish (29 - 4) average is as good as a batsman averaging 48 (40 + 8).
Now, we pick the all-rounders who satisfy both these criteria. 2500+ Test runs at 25 or better, and 150 wickets.
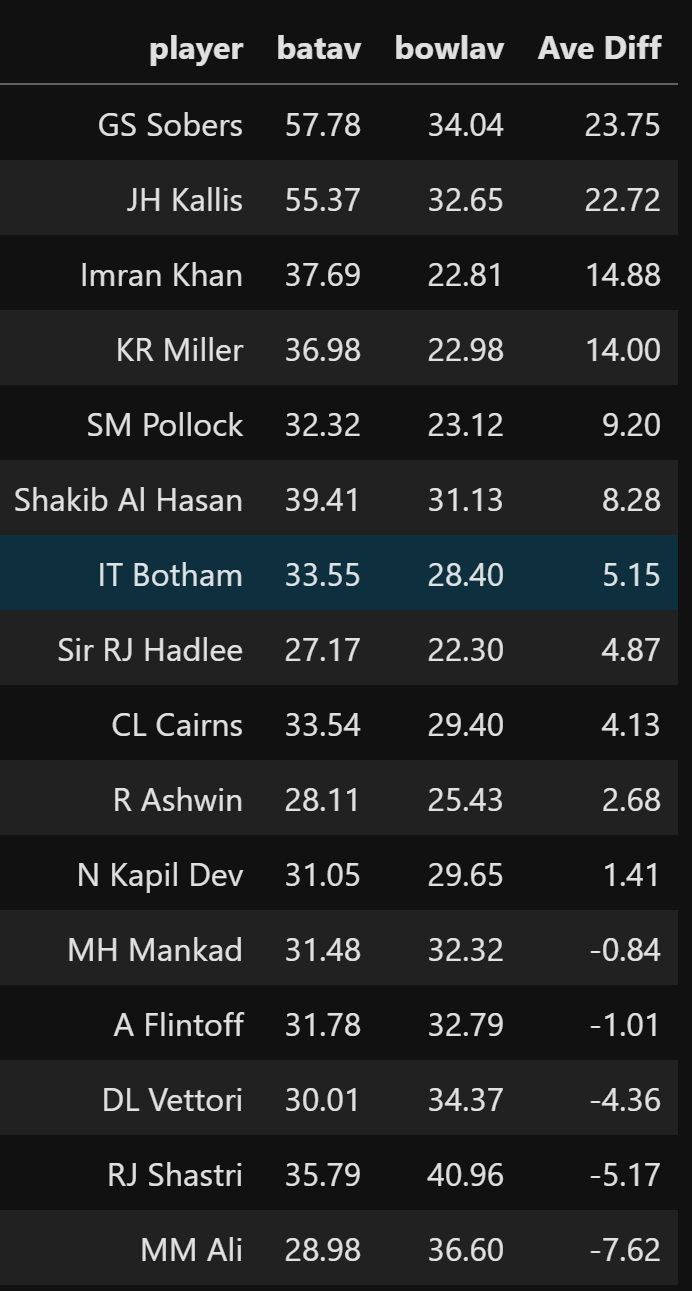
How do they rank by average difference?
Now, let’s convert the raw averages into z-scores. We do this by subtracting the mean batting or bowling average from the player’s average, and then dividing that by the standard deviation.
We rank the players by Z Diff = Batting Z - Bowling Z. A lower bowling z-score is better, a higher batting z-score is better.
The following tables shows the above all-rounders ranked by Z Diff.

Sobers and Kallis are overvalued by the simple average difference, simply because their batting averages are very high. This is corrected for by the Z Diff measure. Imran Khan was a much better bowler than the average bowler, and a not-too-shabby bat compared to the average batsman. Kallis was a great batsman compared to the mean, but his bowling average is a whole standard deviation below the mean bowler, for which he is penalised. The net balance of the two is the Z Diff. Imran is a better “all-rounder” i.e. a combination of both skills than Kallis.
Another measure on the above table is the Z Sum. This is a nifty way of gauging the tilt of an all-rounder’s skills: a positive value implies a batting all-rounder, a negative one a bowling all-rounder. The closer you are to zero, the more equal your two skills are.
This works out neatly: Pollock, Hadlee, Miller, Imran, Ashwin are all clearly bowling all-rounders, while Sobers and Kallis are of the batting kind. Flintoff is almost perfectly balanced, with batting and bowling contributing equally.
Here are the two plotted.

Another way I wanted to check the plying of all-round trades was a career graph of achievements in the two disciplines. For some of the 15 players above, we first plot a 10-match rolling average of the runs per match and wickets per match.
The left and right scales are different. I plotted them together to check the rise and fall of one skill versus the other as a career progresses. The “corr” is the correlation of the two series, designed to check how the progress of one affects the other, on average.

Flintoff has single-peak careers in both trades, the curves effectively rising and falling almost together, split at the halfway stage.

Imran has a significant decline in both batting and bowling towards the end of his career.
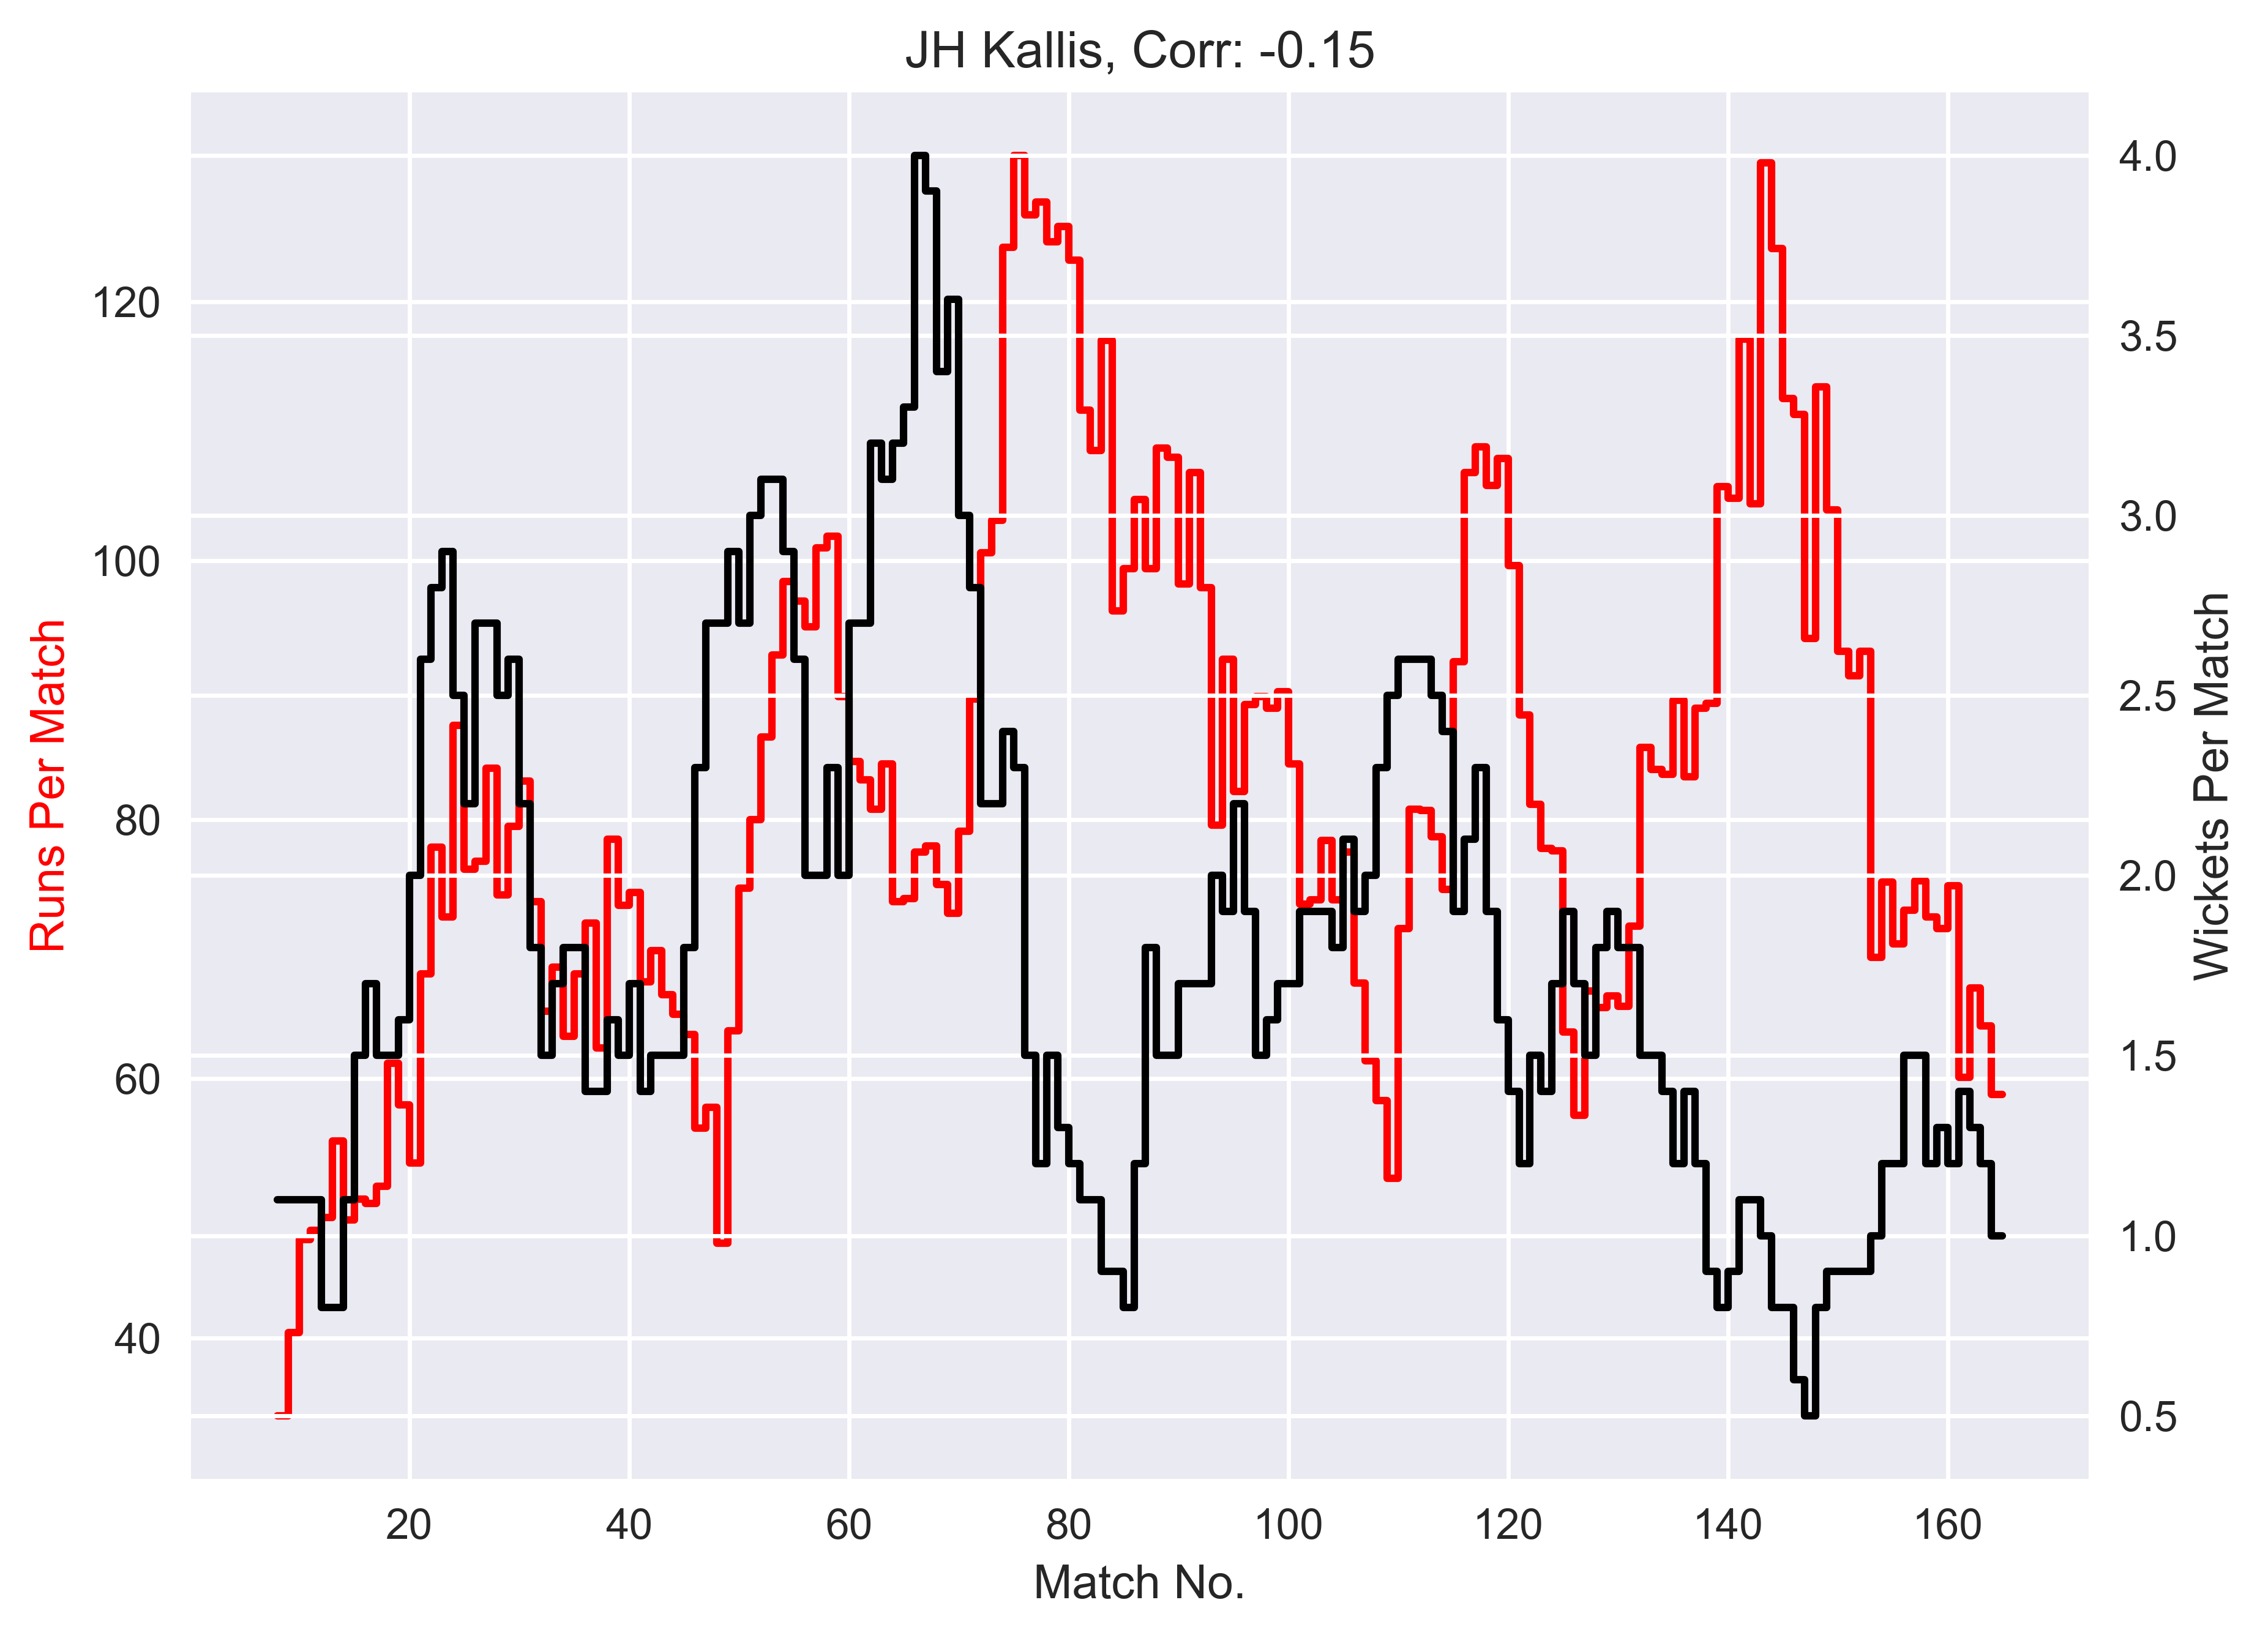
Kallis’s wickets per match has mostly stayed under 3. There’s a significant decrease in wicket averages in the latter half of his career.

A better way to check how much of a bowling / batting role a player has in a team is to check their run percentages and balls bowled percentages through their careers. These are 10-match rolling averages of percentage of team runs scored, and percentage of team balls bowled.
The run contribution will be mostly lower than the ball contribution, because bowling 20% of a team’s innings is more likely than scoring 20% of a team’s runs.

So, Flintoff’s bowling duties got lesser and lesser as his career drew to a close.

Same with Imran, who at his peak was bowling more than 40% of Pakistan’s overs. In the short final epoch of his career, he contributed significantly as a batsman.
Full image sets:
Great work. First time I’m seeing Bayesian statistics in cricket - probably the Cricviz folks use it as well. One way you could make the model more era-adjusted is by using batting and bowling averages in their eras - I believe you will get 30 in each - else you can just take the top 30 bowlers and batters of the era. Kallis and to some extent Sobers played in an extremely batting friendly era. And time to add Jadeja…..
Wonderful analysis and methodology. Imran and Sobers were truly freakish allrounders.
I was wondering if there could be more of an absolute workload analysis for these all rounders in terms of balls faced as a batsman and overs bowled. Would love to see the amount of effort they put into the match and consequently the effort they extracted out of their opponents. For instance the difference between a run a ball 50 ( likely hit in pursuit of quick runs) vs 100 ball 30 would be that the latter requires more focus/energy and extracts more out of the opponent team.
Similar reasoning for bowling. Regarding Imran- going by the timeline of Imran’s tests, his bowling peak shown in your chart coincides with the 1982 /83 series vs India where he destroyed the Indian batting. A cursory glance at those scorecards and the matches preceding did not seem to indicate him bowling 40% of Pak's overs ( majority of those tests were played at spin friendly wickets in Pakistan/Asia) . Or perhaps I misinterpreted this :-)
In any case I do feel that metric- percentage of team overs bowled does not give a full picture of actual bowling workload. For instance low batting totals coming in dominant bowling performances ( like Imran vs India 82/83) mean that the bowler in question would have bowled a bigger share of a low number of overs. Also bowling in unfavorable conditions means the bowler does not get to bowl enough.
Kapi Dev's workload stats could be interesting. I think he probably took on a higher bowling workload but did not stick around to play long enough innings.